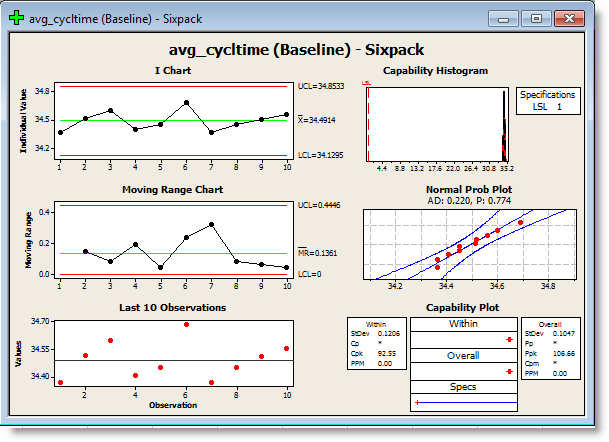
Two charts are generated in Minitab per scenario for each Six Sigma analysis item defined in the Six Sigma Configuration dialog, the Capability Analysis Chart and the Capability Sixpack Chart.
Please Note:
Toggle between the Minitab charts by double-clicking on them in the Project Manager panel, located by default on the left in Minitab.

|
© 2012 ProModel Corporation • 556 East Technology Avenue • Orem, UT 84097 • Support: 888-776-6633 • www.promodel.com |