ProModel®
Discrete Event Simulator
ProModel® is a discrete event simulation and predictive analytics tool, helping provide clarity for your most complex decisions. Accelerate your systems performance while reducing risk with ProModel® AI simulation software.
In business, the only certainty is uncertainty. Unfortunately, that’s not acceptable when you’re running a production line, providing care to patients, or supporting national security.
We provide data-driven solutions in industries that require precise planning and forecasting to ensure operations run smoothly, efficiently, and optimally. You need to know how changes to your operations will impact production and scheduling – today and in the future.
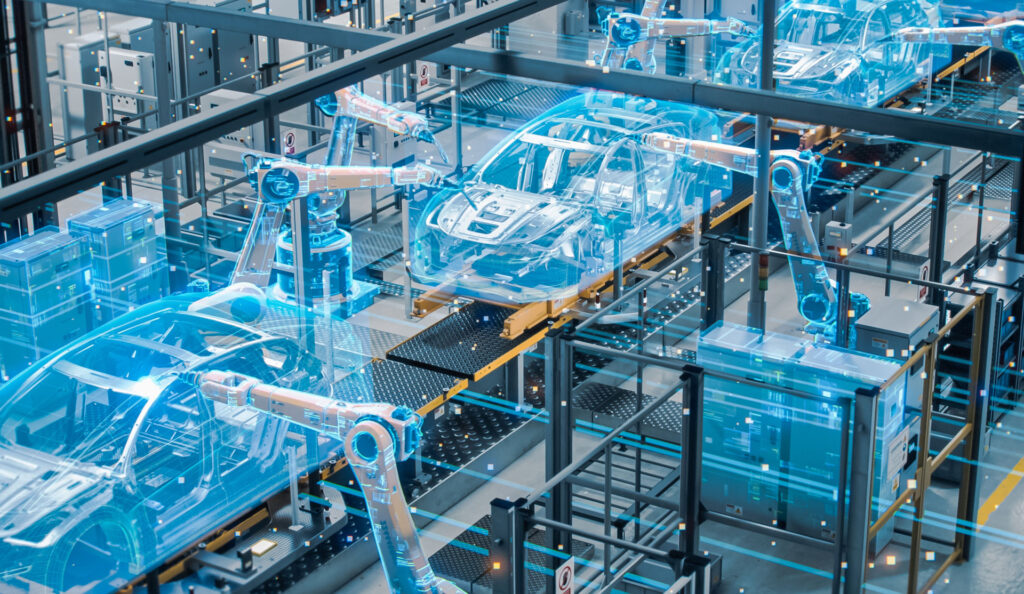
Our AI simulation software products allow organizations to design, simulate, and optimize factory layouts with a digital twin, quickly and accurately forecast patient census and bed capacity, uncover and prevent bottlenecks in operations, and optimize capacity planning and scheduling while streamlining production flows.
ProModel AutoCAD®
Design, simulate and optimize your factory layout before you build it, saving you time, money and lost production due to mistakes and guesswork.
Build spatially accurate models for process simulation using one of the world’s leading computer-aided design software tools.

Process Simulator (PCS)
Leverage dynamic simulation models for better process management. Use visual insights to see where and why bottlenecks occur. Test new workflows and understand the impact of new equipment before implementation.
FutureFlow Rx®
FutureFlow Rx is a patient flow analytics platform that combines predictive analytics, discrete event simulation software and digital twin technology. With FutureFlow Rx, you can quickly, easily, and accurately forecast patient census and bed capacity. Create and test contingency plans through “what-if” scenario analysis.


MedModel
Optimize patient throughput in critical high-volume and high-revenue areas with visual process simulation software. See workflow bottlenecks and understand the impact of change in real-time and on your screen.
Shipyard AI®
Massive and complex operations require extreme precision and perfect timing. Eliminate bottlenecks, reduce costs and deliver on time. Shipyard AI provides automated, accurate and intelligent technology tools to optimize capacity planning and scheduling while streamlining production flows.
ProModel® Content
Explore the different ways ProModel® is accelerating systems performance while reducing risk.

We are a trusted partner focused on helping organizations make their most difficult and important decisions.
BigBear.ai has been delivering unique expertise and transformative technologies since 1988. Get in touch today, and let our experts help your organization.
